Weather data acquisition with the USB WDE1
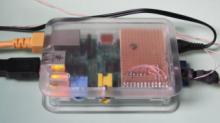
This blog explains some frequently requested technical aspects of the acquisition and processing of weather data in my hobby weather station. The solution is based on the weather sensors KS 300 and S 300 and the USB Weather Data Receiver USB WDE1 from ELV. A small, ARM-based Linux computer like Linksys NSLU2 or Raspberry Pi acts as control computer.
USB Weather Data Receiver USB WDE1
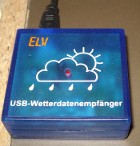 The USB Weather Data Receiver USB WDE1 receives data from diverse weather sensors from ELV wirelessly at 868 MHz. It is available there as a DIY kit and ready-made device.
The receiver is connected to a USB port on the computer. This also delivers power, so no additional power supply is required. The data is transmitted via a simple serial ASCII protocol that has been well documented by ELV. This allows various experiments and creative self-made solutions!
USB WDE1 and Linux
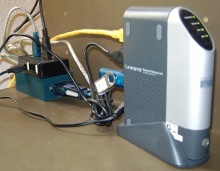
The data acquisition computer - a NSLU2 with Debian GNU/Linux 5.0 (Lenny) - was doing their service five years without complaint. The NSLU2 has two USB ports. At one is plugged a 2GB USB flash drive containing the operating system and data. The other USB port is extended by a USB hub to connect multiple USB devices. One of them is the USB WDE1.
I have repelaced the NSLU2 by the end of 2013 with a Raspberry Pi Model B. It also has two USB ports, but both are freely available because the operating system is located on an extra memory card. The following comments apply to both hardware equipments, the software could be transferred from the the NSLU2 to the Raspberry Pi without modifications.
The USB interface of the USB WDE1 is realized by the USB-to-serial converter CP 2102 from Silicon Labs. The appropriate kernel module cp2101 is included in modern Linuxes. When connecting the USB WDE1 should therefore appear the corresponding messages immediately in the system log:
$ dmesg
usb 1-2.1: Product: ELV USB-WDE1 Wetterdatenempfänger
usb 1-2.1: Manufacturer: Silicon Labs
The udev subsystem should then also create a corresponding device file, usually /dev/ttyUSB0. This device behaves like a serial interface and can therefore be operated with any terminal program, such as minicom for example. If you have connected other USB-to-serial converters to the computer, the device may have another name, like /dev/ttyUSB1 or similar. It is important to set the baud rate to 9600 bit/s.
In order to read the weather data supplied by the WDE-1 via the serial interface, the tool socat did a good job working on the NSLU2 without problems. On RaspberryPi however, socat shows several weaknesses in conjunction with the weather data receiver, such as frequent error messages WRONG VAL, WRONG CMD and FullBuff->Reset as well as incomplete data. Better experiences I made here with pyserial, a Python module for controlling the serial interface. If not already installed, you can install it easily using the package manager:
sudo apt-get install python-serial
The small Python script serialmon.py (download link at the end of the article) is used to output the data from the USB WDE1 at the console:
#!/usr/bin/python -u

import serial
import sys
import os

# serial port of USB-WDE1
port = '/dev/ttyUSB0'

# MAIN
def main():
  # open serial line
  ser = serial.Serial(port, 9600)
  if not ser.isOpen():
    print "Unable to open serial port %s" % port
    sys.exit(1)

  while(1==1):
    # read line from WDE1
    line = ser.readline()
    line = line.strip()
    print line

if __name__ == '__main__':
  main()
After starting serialmon.py the output of the weather receiver should be seen at the console, for example:
$1;1;;;;;;13,0;;;;;;;;58;;;;18,9;39;0,0;2680;0;0
$1;1;;;;;;13,0;;;;;;;;58;;;;18,9;39;0,0;2680;0;0
$1;1;;;;;;13,0;;;;;;;;58;;;;18,9;39;0,0;2680;0;0
$1;1;;;;;;12,9;;;;;;;;58;;;;18,9;39;0,0;2680;0;0
$1;1;;;;;;12,9;;;;;;;;58;;;;18,8;40;0,0;2680;0;0
Each row represents a complete data set, which consists of 25 semi-colon separated fields. The first three fields are invariable, then the temperature readings (°C) of eight sensors (for example S 300) follow and then the humidity values (%) of these eight sensors. After that come temperature (°C), humidity (%), wind speed (km/h), rainfall (rocker strokes) and rain sensor (0/1) values of the combination sensor KS 200 or KS 300. The last field with the constant value 0 indicates the end of the record.
Data Acquisition with RRDtool
For a long-term weather data recording the records should be written into a database. The resulting amount of data, however, is immense when, for example, you would like to capture and store one record per minute over ten years. It is therefore appropriate to familiarize yourself some thoughts about a sensible limit of the amount of data according to the intended use case. So it is perhaps quite sufficient to store a record only every 15 minutes for a hobby use case. And after one year I have no interest in the exact temperature at a certain time of the day - daily average, minimum and maximum values are fine.
The storage of the measured values takes RRDtool. This is in the core a round-robin database with a very efficient system for generating graphics. RRDtool is open source, well documented and can be installed on Linux easily via the package manager:
sudo apt-get install rrdtool python-rrdtool
At the beginning of the work with RRDtool is the definition of the database. Here, we must first think about temporal resolution and extent of data to be stored. A possible definition for the use case "hobby weather station" is:
- All sensors captured from the USB WDE1 are recorded, these are 2 * 8 + 5 sensors = 21 Data Sources
- The measurement is based on one average value for each quarter hour (900 seconds). This value is kept 10 days which are 4 * 24 * 10 = 960 samples per DataSource.
- After these 10 days, there is an automatic reduction of the data to one average, minimum, and maximum value per day.
- The retention time of the daily values is 10 years, that are 3600 samples per DataSource.
This yields to the following call of rrdtool to create the database (Script create_weather_rrd.s - download link at the end of the article):
rrdtool create weather.rrd --step 900 \
DS:temps1:GAUGE:1200:-40:50 \
DS:temps2:GAUGE:1200:-40:50 \
DS:temps3:GAUGE:1200:-40:50 \
DS:temps4:GAUGE:1200:-40:50 \
DS:temps5:GAUGE:1200:-40:50 \
DS:temps6:GAUGE:1200:-40:50 \
DS:temps7:GAUGE:1200:-40:50 \
DS:temps8:GAUGE:1200:-40:50 \
DS:hums1:GAUGE:1200:0:100 \
DS:hums2:GAUGE:1200:0:100 \
DS:hums3:GAUGE:1200:0:100 \
DS:hums4:GAUGE:1200:0:100 \
DS:hums5:GAUGE:1200:0:100 \
DS:hums6:GAUGE:1200:0:100 \
DS:hums7:GAUGE:1200:0:100 \
DS:hums8:GAUGE:1200:0:100 \
DS:temps9:GAUGE:1200:-40:50 \
DS:hums9:GAUGE:1200:0:100 \
DS:winds9:GAUGE:1200:0:200 \
DS:rains9:DERIVE:1200:0:U \
DS:israins9:GAUGE:1200:0:1 \
RRA:AVERAGE:0.5:1:960 \
RRA:MIN:0.5:96:3600 \
RRA:MAX:0.5:96:3600 \
RRA:AVERAGE:0.5:96:3600
The parameter --step 900 defines the basic data collection interval to 900 seconds (15 minutes).
The definition of data sources (DS) follows - one for each sensor. The names of the DataSources are following the scheme tempsn for a temperature sensor and humsn for a humidity sensor with n = 1..9, the sensor number. The temperature range is limited to -40..50 °C. winds9 is the anemometer at the combined sensor and israins9 the rain sensor. All of these data sources are of type GAUGE, i.e., the measured value is stored in the database just as it has delivered the USB WDE1.
Data source rains9 is interesting: This is the rain gauge. It is implemented in the form of a rocker who once teeters after the damming of a defined amount of water while counting up a counter. The WDE1 provides this count and thus a measure of the total rainfall since switching on the weather station. In general, however, one is interested in the amount of rain per time unit, i.e. per hour or per day. Therefore, the according DataSource is defined here with the type DERIVE, which performs automatic differentiation of the value after time.
At the end is the definition of the Round Robin Archives (RRA), which are responsible for the actual data storage. The first definition specifies that 960 samples are stored undiluted, that is, with a step size of 1. The following three RRAs cause the storage of 3600 minimum, maximum and average values. The calculation of these three variables is carried out for each of 96 samples, which is exactly one day (96 * 900 seconds).
Running the command creates the file weather.rrd which occupies just under 2 megabytes of disk space. The file size does not change, no matter how many records are inserted - after all it is a round-robin database!
When moving the database from the NSLU2 to the Raspberry Pi, it was noted that the binary data is not compatible because there are two different processor architectures (ARMv5/XScale and ARMv6/ARM11). One may therefore not simply copy the database file weather.rrd from one hardware to the other, but must detour via a database dump in XML format:
# at NSLU2:
rrdtool dump weather.rrd > weather.xml
# at Raspi:
rrdtool restore weather.xml weather.rrd -f
Recording is in progress!
To insert the data into the database we extend the Python script. At the beginning the additional import of the module rrdtool is required:
# ...
import rrdtool
The output print line is replaced with the conversion of the data supplied by the USB WDE1 into a format that rrdtool understands (Full source code in recweather.py - see download link at the end of the article):
    # ...
    #print line

    data = line.split(';')
    if (len(data) == 25 and data[0] == '$1' and data[24] == '0'):
      # data is valid
      # re-format data into an update string for rrdtool
      for i, val in enumerate(data):
        data[i] = ('U' if val == '' else val.replace(',', '.'))
      update = 'N:' + ':'.join(data[3:24])
      # insert data into database
      rrdtool.update(
        "%s/weather.rrd" % (os.path.dirname(os.path.abspath(__file__))),
        update)
      # terminate the program - we get invoked regularly from cron
      break
If an entire data set has arrived, rrdtool.update writes the processed data into the round robin database, which is located in the same directory as the script itself. This involves the computation of average and limit testing according to the rules specified when creating the database.
The final break statement ends the loop and program. If one were to omit them, then the program remains in an endless loop and writes all incoming data immediately into the database. This can be fairly common, depending on the number of wireless sensors. If the database file is on an SD card or a USB memory stick, then you should note that these media only tolerate a certain number of write cycles. In addition, of course you have to monitor a constantly running program regularly and check if it has not been terminated by an error, and then restart it if required.
In my weather station the cron service starts the script every five minutes. After the successful processing of a data set and the update of the database it terminates immediately. The corresponding entry in the user's cron file is
3-58/5 * * * * $HOME/weather/recweather.py >> $HOME/weather/recweather.log 2>&1
Graphic
An outstanding feature of rrdtool is the built-in graphics engine that can create appealing graphics. A graph of the temperature over the past week at the sensors temps5 and temps9 may be created by:
rrdtool graph tempweek.png \
  -s 'now - 1 week' -e 'now' \
  DEF:temps5=weather.rrd:temps5:AVERAGE \
  LINE2:temps5#000000:Basement \
  DEF:temps9=weather.rrd:temps9:AVERAGE \
  LINE2:temps9#0000FF:Outside
The parameters -s and -e specify the time range. DEF defines variables by RRD file name, DataSource and consolidation function. LINE2 draws a line for each variable, indicating the color and name. RRDtool will then take care of appropriate scaling and labeling of the image: 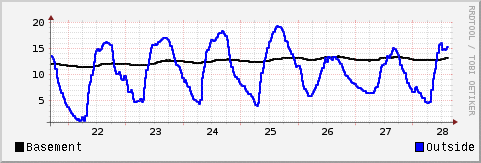
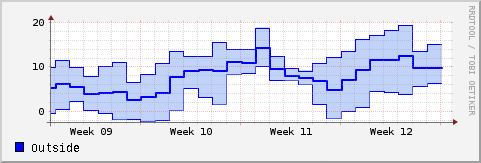
To display average, minimum and maximum values, slightly more preparation is necessary. The key is the calculation of a virtual data set by means of CDEF that contains the difference between the minimum and maximum values. This is then displayed as an area using the keyword AREA; the parameter STACK causes the area not starting at the X-axis, but stacked on the previous LINE1:
rrdtool graph tempmonth.png \
  -s 'now - 1 month' -e 'now' \
  DEF:tempmins9=weather.rrd:temps9:MIN \
  DEF:tempmaxs9=weather.rrd:temps9:MAX \
  DEF:temps9=weather.rrd:temps9:AVERAGE \
  CDEF:tempranges9=tempmaxs9,tempmins9,- \
  LINE1:tempmins9#0000FF \
  AREA:tempranges9#8dadf588::STACK \
  LINE1:tempmaxs9#0000FF \
  LINE2:temps9#0000FF:Outside
It is raining!
The graphical representation of humidity and wind speed follows the same pattern, because thay are also absolute values. However, special treatment is needed for rainfall: As already explained, the rainfall data source returns the number of rocker strokes. Due to the type definition DERIVE the database differentiates this measured value and stores the value "rocker strokes per second". In order to compute the rainfall in millimeters per day, you first need the information how rainfall corresponds to a rocker strokes. The documentation of the WDE1 will help you:
1 rocker stroke = 295 ml/m² = 0.295 mm
Since a day has 24 hours for 3600 seconds you can now calculate the virtual variable rainpd by a CDEF statement that provides the required rainfall per day. The example also shows how to calculate the total amount of rain per month rainpm and output it as text using GPRINT:
rrdtool graph rainmonth.png \
  -s '01.05.2010' -e '31.05.2010' \
  -v mm/d \
  DEF:rains9=weather.rrd:rains9:AVERAGE \
  CDEF:rainpd=rains9,3600,*,24,*,0.295,* \
  CDEF:rainpm=rainpd,30,* \
  VDEF:totalrain=rainpm,AVERAGE \
  GPRINT:totalrain:"Total %6.0lf mm/Mon" \
  LINE2:rainpd#0000FF

Conclusion
This article covers only some aspects of my weather station. Not described are the barometer with the BMP085 and the 1-wire interface for temparature and air pressure - more on that elsewhere. Specifically, I would like to point out that the techniques described are only suitable for the hobby and private use.
Interesting links
- Download Script Code
- Temperature measurement with the Raspberry Pi and the 1-wire temperature sensor DS1820
- 1-wire temperature sensor DS1820 on Raspberry Pi - Minimal variant for a 1-wire bus on Raspberry Pi
- Barometer with the Raspberry Pi and the I2C air pressure sensor BMP085
- ELV - Distribution of Weather Stations and Sensors
- NSLU2 und Linux - Linux on the Linksys NSLU2
- Debian on NSLU2 - Installation of Debian Linux on the NSLU2
- RRDtool - Open Source data acquisition and visualisization tool