1-wire temperature sensor DS1820 at Raspberry Pi (GPIO directly)

To measure the indoor or outdoor temperature with the Raspberry Pi, there are several possibilities. This article describes the version with the minimal amount of external components. This is based on the DS18S20 temperature sensor and the software emulation of the 1-wire protocol.
Temperature sensor DS1820
DS18S20 and related DS18B20 and DS1822 are integrated circuits in a TO-92 housing containing the temperature sensor, analog-to-digital converter and 1-wire interface. The types mentioned are pin and software compatible, they differ substantially in the measurement accuracy and price. The three connectors (see picture left) are ground (GND, pin 1), data (DQ pin 2) and operating voltage (VDD, pin3).
1, 2, or 3 wires?
The term "1-wire" is of course misleading. At least a second line is required for the reference potential GND. You can connect VDD and GND and operate the sensor with a parasitic power supply of 3 to 5 volts. The connection of the circuit is then possible with a simple two-wire twisted pair cable.
But it is also possible to operate the DS1820 with an active power supply. To do this, you need a three-wire cable that also connects VDD to the operating voltage of 3 to 5 volts.
You may connect several DS1820 parallel at a single 1-wire bus. Each sensor has a unique code assigned by the manufacturer to identify itself.
The decision whether to choose parasitic or active power supply should be made before starting the project and should be considered very carefully. The lower effort of material for the two-core cable speaks in favor of the parasitic supply. However, this can lead to problems with many parallel sensors on the bus, high temperatures and long cables. There were and are sometimes problems with certain versions of the 1-wire kernel driver under Linux due to the more critical timing in the case of parasitic supply.
In case of doubt and with high demands on reliability, I would always opt for an active supply and the necessary three-wire cable.
Raspberry Pi and 1-wire
Temperature measurement with the Raspberry Pi and the 1-wire temperature sensor DS1820 contains a list of different ways to drive a 1-wire bus from the Raspberry Pi. This paper describes the solution (1) with the least amount of external circuitry. You need apart from the sensors only a single resistor, as this solution completely simulates the 1-wire protocol in software.
Passive parasitic supply (two-wire cable)
The data port DQ of the DS1820 is connected directly to the port GPIO4 of the GPIO interface of the Raspberry Pi. GND and VDD are at ground terminal GND. The parasitic power supply is accomplished by a pull-up resistor of 4k7 between the 3.3 volt connection 3V3 and GPIO4.
Active power supply (three-wire cable)
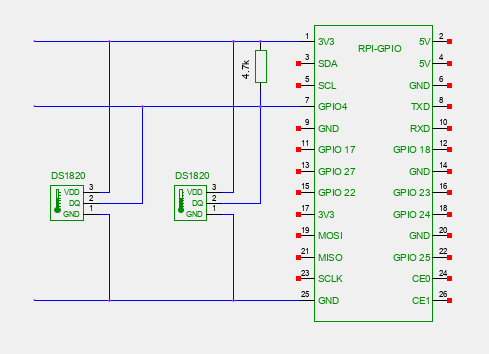
The data port DQ of the DS1820 is also connected directly to the port GPIO4 of the GPIO interface. GND is connected to the ground port GND, whereas VDD is connected to the 3.3 volt port 3V3. The resistor between 3V3 and GPIO4 now only serves as a pull-up resistor to set a defined potential on the data line.
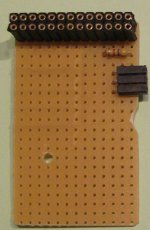
The resistor, a female connector for attachment to the GPIO port and the 1-wire connection is soldered to a small breadboard, which sits directly on the GPIO port. The 1-wire connection can be realized with a space-saving angled female connector. All this fits into the case of the Raspberry Pi.
1-wire software drivers
At first the activation of the device tree overlay (dto) for 1-wire is necessary. To do this, edit the file /boot/config.txt (using sudo nano or another editor of your choice) and add the following line:
dtoverlay=w1-gpio,gpiopin=4,pullup=on
The parameter pullup=on is only necessary with parasitic supply, with active power supply (3-wire) the line reads accordingly:
dtoverlay=w1-gpio,gpiopin=4
After the necessary reboot, use the lsmod command to make sure that the required kernel modules w1_gpio and w1_therm are loaded:
lsmod | grep w1

w1_therm               20480  0
w1_gpio                16384  0
wire                   36864  2 w1_gpio,w1_therm
If this is not the case, you have to load the modules manually. With older versions of Raspbian OS, this was still required regularly:
sudo modprobe w1-gpio pullup=1
sudo modprobe w1-therm
Here, too, the parameter pullup=1 is only necessary for parasitic supply. To let the kernel loading the modules automatically when the system starts in the future, you should add them to the file /etc/modules:
# /etc/modules
w1-gpio pullup=1
w1-therm
As I said, this is only necessary with older versions of Raspbian. The current Raspberry Pi OS loads the modules automatically if the dtoverlay option shown above is present in config.txt.
The modules create a subdirectory for each sensor found just below /sys/bus/w1/devices. The directory name is composed of the Family Code of the sensor and its unique identification number. Sensors of the type DS1820 and DS18S20 have the Family Code 10, DS18B20 has Code 28 and DS1822 the 22. In each subdirectory there is the file w1_slave containing the sensor status and measured temperature value:
cd /sys/bus/w1/devices
cd 10-000801b5*
cat w1_slave

0f 00 4b 46 ff ff 06 10 0c : crc=0c YES
0f 00 4b 46 ff ff 06 10 0c t=7375
The file consists of two lines, each containing the hexadecimal register-dump of the sensor IC. At the end of the first line is the checksum (CRC) and the information whether it is a valid reading (YES). The second line ends with the temperature reading in thousandths of a degree Celsius. In the example, the temperature is thus 7.375 °C. The accuracy to three places after the decimal point is of course only apparent; the datasheet of DS18S20 states, for example, that the measurement accuracy is only 0.5° C. The actual temperature is so anywhere from 6.8 to 7.9° C.
Round Robin Database RRDtool
For a long-term recording of temperature readings and comfortable generation of graphics, the use of RRDtool is recommended. The articles Weather data acquisition with the USB WDE1 and Temperature measurement with the Raspberry Pi (USB-serial) explain this tool in detail.
First you have to install RRDtool with the aid of the Package Manager at the Raspberry Pi:
sudo apt-get install rrdtool python-rrdtool
The second installed package python-rrdtool is a Python interface to RRDtool, which is used later. At the beginning of the work with RRDtool is the definition of the database. The following example creates a database for two temperature sensors temp0 und temp1. The aim is to store one value per quarter hour (900 seconds). After ten days (= 960 values), a reduction takes place to one average, minimum, and maximum value per day. The retention time of these daily values is ten years (= 3600 values):
rrdtool create temperature.rrd --step 900 \
DS:temp0:GAUGE:1200:-40:80 \
DS:temp1:GAUGE:1200:-40:80 \
RRA:AVERAGE:0.5:1:960 \
RRA:MIN:0.5:96:3600 \
RRA:MAX:0.5:96:3600 \
RRA:AVERAGE:0.5:96:3600
Data Acquisition with Python
A Python scripts reads the special files w1_slave and inserts the temperature values into the round-robin database:
#!/usr/bin/python
# -*- coding: utf-8 -*-

import re, os, rrdtool, time

# function: read and parse sensor data file
def read_sensor(path):
  value = "U"
  try:
    f = open(path, "r")
    line = f.readline()
    if re.match(r"([0-9a-f]{2} ){9}: crc=[0-9a-f]{2} YES", line):
      line = f.readline()
      m = re.match(r"([0-9a-f]{2} ){9}t=([+-]?[0-9]+)", line)
      if m:
        value = str(float(m.group(2)) / 1000.0)
    f.close()
  except (IOError), e:
    print time.strftime("%x %X"), "Error reading", path, ": ", e
  return value

# define pathes to 1-wire sensor data
pathes = (
  "/sys/bus/w1/devices/10-000801b5a7a6/w1_slave",
  "/sys/bus/w1/devices/10-000801b5959d/w1_slave"
)

# read sensor data
data = 'N'
for path in pathes:
  data += ':'
  data += read_sensor(path)
  time.sleep(1)

# insert data into round-robin-database
rrdtool.update(
  "%s/temperature.rrd" % (os.path.dirname(os.path.abspath(__file__))),
  data)
The reading of w1_slave is made in the function read_sensor. It tests whether the first line ends with YES and thus there exists a valid checksum. If so, then the function extracts the temperature value from the second line of the file and returns the value in degrees Celsius. In case of error, it returns the value U, which is interpreted as "Unknown" by RRDtool.
In the main program are first the definitions of the paths to the temperature sensors - these of course you need to change! Then the script reads in all of the sensors by calling the function read_sensor. The waiting time of one second is to improve the transient response of the parasitic power on the data bus. At the end of the insertion of the measured values into the round robin database is done. The construction of the path to the database assumes that the script and the database are in the same directory.
The script is stored in the executable file gettemp.py and you may execute it on the command line. The result can be checked using rrdtool lastupdate. This ouputs the time stamp and the values of the last update of the database:
chmod +x gettemp.py
./gettemp.py
rrdtool lastupdate temperature.rrd
 temp0 temp1

1386777156: 18.937 5.687
You may put the script call into your crontab:
echo '2-57/5 * * * * $HOME/temperature/gettemp.py >> $HOME/temperature/gettemp.log 2>&1' | crontab -
With this definition, the cron daemon executes every five minutes the script, starting with the second minute after the hour. An output redirection sends error messages into the file gettemp.log. Because the database is defined with the smallest measurement interval of 15 minutes, an averaging of three readings takes place.
Graphics and more
Did hardware and software for a while diligently collected temperature readings, then RRDtool can create nice graphics, for example, visualize the history of the temperature of the last week as a line graph:
rrdtool graph tempweek.png \
  -s 'now - 1 week' -e 'now' \
  DEF:temp0=temperature.rrd:temp0:AVERAGE \
  LINE2:temp0#00FF00:Inside \
  DEF:temp1=temperature.rrd:temp1:AVERAGE \
  LINE2:temp1#0000FF:Outside

More about "Graphics with RRDtool" and the building a web application for data presentation can be found in the blogs Weather data acquisition with the USB WDE1 and Temperature measurement with the Raspberry Pi.
Conclusion
The proposed project implements a temperature measuring station based on the Raspberry Pi with minimal external hardware. The parasitic power supply of the sensors requires only a two-wire cable, but the maximum possible cable length is likely to be limited compared to an active power supply. If you need to measure temperatures above 70° C, then you should definitely provide an active power supply with a three-wire cable. The GPIO ports on the Raspberry Pi are connected without further buffering with the 1-wire bus. Therefore, the coupling of interference by parallel routed power lines is particularly to be avoided! The solution is working at my home for several years reliably with two sensors and a two-wired cable with a length of about ten meters.
Interesting links
- Raspberry Pi Wiki at eLinux.org
- Raspberry Pi Foundation
- OWFS 1-Wire File System - Comprehensive reference to 1-wire hardware and software
- RRDtool - Open Source data acquisition and visualization tool