Barometer with the Raspberry Pi and the I2C air pressure sensor BMP085

An important part of a weather station is to measure the air pressure with a barometer. The integrated digital air pressure sensor BMP085 can be connected to the Raspberry Pi with minimal effort due to the presence of the I²C bus.
Air pressure and barometer
Our weather is significantly influenced by the air pressure and the associated flows. High air pressure is usually for sunny and dry weather, while a low pressure system is bringing rain and storm with it. Significant changes in the air pressure within a short time signal an impending change in the weather. The measurement and recording of air pressure is therefore a useful and worthwhile activity for the amateur meteorologist.
A barometer measures the air pressure that is built up by the weight of the atmosphere at a particular place. Apart from the weather it also depends on the height of the place. In order to obtain comparable air pressure values for meteorological purposes, the measured barometric pressure is always converted to sea level (Normal-zero).
The unit of measurement used internationally for the air pressure is the pascal (Pa). To get easy to handle numerical values, it is usually to quote the air pressure in hectopascal (hPa). The numerical value is then identical to the unit millibar formerly often used.
The normal average air pressure at sea level is 1013 hPa. I measured with my weather station the extreme values 1,036 hPa (high pressure) and 988 hPa (low pressure) during the last year.
Air pressure sensor BMP085
Several years ago, the construction of an electronic barometer for connection to a computer was still relatively expensive. A workable solution consisted of the combination of an analog pressure sensor (e.g. MPX4115A) with an operational amplifier and a digital-to-analog converter. Meanwhile circuits such as the Bosch BMP085 or his successor BMP180 are available that integrate all these components into one housing. The transmission of measured values takes place via an I²C bus. Since the Raspberry Pi also provides an I²C bus at its GPIO connector, the connection of a BMP085 or BMP180 is possible with minimal effort.
One hurdle to overcome is still ahead: The circuits are available only in LCC or LGA housings, which are to process with hobby tools hardly. Fortunately, both Adafruit and Sparkfun offer breakout boards, which break up the terminals of the IC to a 5-pin 0.1" (2.5 mm) pitch header. The following statements refer to the BMP085, but the BMP180 should work as well without major changes.
Prototype with breadboard
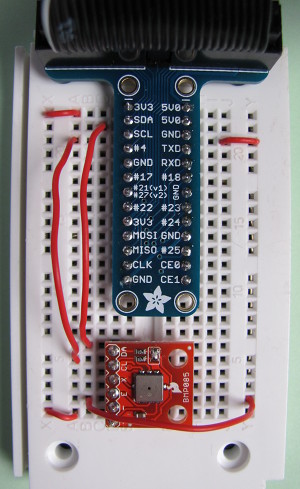
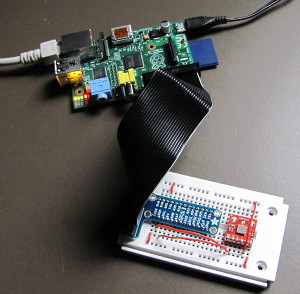
A useful first step to get to know new hardware and software is to build a prototype. A universal breadboard is great for this. It is connected via the Pi T-Cobbler from Adafruit with the Raspberry Pi. The BMP085 Breakout also fits onto the breadboard. Then connect the four pins of Cobbler and BMP085 (see picture left): Ground (GND, -), operating voltage (3V3, +), clock (SCL, CL) and data (SDA, DA). It is important that the operating voltage is 3.3 volts, and not 5 volts! Now plug the connector of the Pi T-Cobbler into the GPIO connector of the Raspberry Pi. Ensure the correct polarity: The white line on the ribbon cable belongs to pin 1 located on the side of the SD card slot (see picture below).
Preparation of software
The communication between the Raspberry Pi and air pressure sensor uses the I²C bus. The necessary kernel modules are part of Raspbian "wheezy", you just have to add their names to the file /etc/modules:
i2c-bcm2708
i2c-dev
The blacklist entries in /etc/modprobe.d/raspi-blacklist.conf shall be removed or commented out:
#blacklist spi-bcm2708
#blacklist i2c-bcm2708
Newer versions of the operating system Raspbian starting with Kernel 3.18 (February 2015) require the separate activation of the Device Tree overlay for I²C. The easiest way to do so would be to run
sudo raspi-config
Select Advanced Options - I2C from the menu and confirm the dialog box with Yes.
Since the test program should run under Python, you may install now the required Python modules and tools for working with the I²C bus:
sudo apt-get install python-smbus i2c-tools
Thus the measurement program does not have to run with superuser privileges constantly, the corresponding user (for example, the default user pi) should be a member of the group i2c:
sudo adduser pi i2c
Now it's time to reboot the Raspberry Pi with attached air pressure sensor. The kernel should then load the I²C modules. After logging in as a user pi you should verify that hardware and software are working so far with i2cdetect. The output shows that communication with the I²C address 77 is possible. This address is permanently assigned to the BMP085 and BMP180:
i2cdetect -y 1

     0  1  2  3  4  5  6  7  8  9  a  b  c  d  e  f
00:          -- -- -- -- -- -- -- -- -- -- -- -- --
10: -- -- -- -- -- -- -- -- -- -- -- -- -- -- -- --
20: -- -- -- -- -- -- -- -- -- -- -- -- -- -- -- --
30: -- -- -- -- -- -- -- -- -- -- -- -- -- -- -- --
40: -- -- -- -- -- -- -- -- -- -- -- -- -- -- -- --
50: -- -- -- -- -- -- -- -- -- -- -- -- -- -- -- --
60: -- -- -- -- -- -- -- -- -- -- -- -- -- -- -- --
70: -- -- -- -- -- -- -- 77
The measurement program
The BMP085 provides uncompensated "raw" values for temperature and air pressure. The manufacturer has stored the calibration information necessary for the calculation of the compensated correct values in a 176 bit E²PROM - only the calculation one must still perform yourself. The data sheet provides detailed information.
If you want to save this job you may use an open source software from Adafruit. It is programmed in Python, which is installed as part of the operating system Raspbian. Since it is a scripting language you can relatively comfortable experiment with the software and adapt it for your own purposes.
Adafruit has published the software as a Git repository on Github. This is duplicated into a local directory by
git clone https://github.com/adafruit/Adafruit-Raspberry-Pi-Python-Code.git
The supplied sample program should already provide first results:
cd Adafruit-Raspberry-Pi-Python-Code/Adafruit_BMP085
./Adafruit_BMP085_example.py

Temperature: 21.90 C
Pressure:    1018.14 hPa
Altitude:    -40.80
The program displays the temperature and the measured absolute air pressure at your site. The elevation is true only if you have previously entered the current air pressure at sea level into the script. But this is not the intended application for a weather station. Here, the initial situation is reversed: the height of the weather station above sea level is known, and you want to determine the related sea level air pressure. Only this is comparable to other weather stations and therefore suitable for meteorological purposes.
Using a small change the script Adafruit_BMP085_example.py fits into our needs:
#!/usr/bin/python
# -*- coding: utf-8 -*-

from Adafruit_BMP085 import BMP085

bmp = BMP085(0x77)
temp = bmp.readTemperature()

# Read the current barometric pressure level
pressure = bmp.readPressure()

# Set the altitude of your current location in meter
altitude = 95
psea = pressure / pow(1.0 - altitude/44330.0, 5.255)

print "Temperature:           %8.2f °C" % temp
print "Pressure:              %8.2f hPa" % (pressure / 100.0)
print "Pressure at sea level: %8.2f hPa" % (psea / 100.0)
The calculation of the air pressure at sea level is carried out by means of a simplified barometric formula. The variable altitude provides the required height of the weather station above sea level. You might have to adjust this for your site. The approximate value can be determined on the website GeoPosition. By comparing the computed pressure with a meteorological station, the height can be determined exactly - more on that later.
Recording with RRDtool
The modified script prints measured and calculated values to the console:
./Adafruit_BMP085_example.py

Temperature:           22.30 °C
Pressure:              1018.06 hPa
Pressure at sea level: 1029.24 hPa
For the visualization and analysis of atmospheric pressure the manual execution of the script is inappropriate. For this purpose, a long-term recording of measured values into a database and a convenient way to create graphics is necessary. To limit the amount of stored data over a long time, the use of a round-robin database is recommended. It holds high temporal resolution readings on only a certain number of days. This is followed by an automatic consolidation of data so that only the daily average values are kept in the database. After a long time, you can also override these values. Thus, the memory requirements of the database are kept into predetermined limits.
An implementation of this principle is RRDtool, which can be easily installed with the help of the package manager on the Raspberry Pi:
sudo apt-get install rrdtool python-rrdtool
At the beginning of the work with RRDtool is the definition of the database. The following example creates a simple database that stores the temperature temp and the atmospheric pressure at sea level psea. It should store one value tuple per quarter hour (900 seconds). After ten days (= 960 values), a reduction takes place to one average, minimum, and maximum value per day. The retention time of the daily values is ten years (= 3600 values):
rrdtool create pressure.rrd --step 900 \
DS:temp:GAUGE:1200:-40:80 \
DS:psea:GAUGE:1200:950:1050 \
RRA:AVERAGE:0.5:1:960 \
RRA:MIN:0.5:96:3600 \
RRA:MAX:0.5:96:3600 \
RRA:AVERAGE:0.5:96:3600
Now we extend the Python script at the end with the writing of the measurement values into the database. Script and database must reside in the same directory:
# ... as above

import os, rrdtool

# insert data into round-robin-database
data = "N:%.2f:%.2f" % (temp, psea/100.0)
rrdtool.update(
  "%s/pressure.rrd" % (os.path.dirname(os.path.abspath(__file__))),
  data)
Whether the script is actually writing data into the database can be checked using rrdtool lastupdate pressure.rrd. This command returns the timestamp and the values of the last update of the database. For continuous operation it makes sense to delegate the script call to the scheduling service cron.
Data collected?
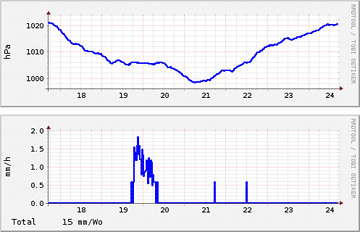
After some time of continuous data collection, it is worthwhile to take a look at the graphics capabilities of RRDtool. The following command creates a graphics file pressure.png with the air pressure over the last week:
rrdtool graph pressure.png \
  -s 'now - 1 week' -e 'now' \
  -A -Y -X 0 \
  DEF:psea=pressure.rrd:psea:AVERAGE \
  LINE2:psea#0000FF:
More about "Graphics with RRDtool" up to building a web application for data presentation can be found in the blogs Weather data acquisition with the USB WDE1 and Temperature measurement with the Raspberry Pi.
Of course you can output the data as well as numerical values:
rrdtool fetch pressure.rrd AVERAGE -s 'now - 1 week'

1389978000: 3.8599258026e+01 1.0035865546e+03
1389978900: 3.8799765815e+01 1.0036133266e+03
1389979800: 3.8766727854e+01 1.0036799544e+03
...
The second and third column contain the measured temperature and air pressure values. The first column is the date as a Unix timestamp, i.e. the number of elapsed seconds since 1.1.1970 0:00 UTC. To convert it to a readable date, the following one-liner is suitable:
rrdtool fetch pressure.rrd AVERAGE -s 'now - 1 week' | awk -F: '{print "@"$1}' | date +"%d.%m.%Y %H:%M.%S" -f -
Calibration
The measured values obtained in this way are suitable for checking and calibration of the DIY barometer. To do this they are imported into a spreadsheet, such as LibreOffice Calc, or the like. Then search the internet for the air pressure readings of a professional weather station near your location and copy them also into the spreadsheet. For my weather station located in Rüsselsheim I use to compare the data of the airport Frankfurt/Main.
With the correct assignment of the two data series based on the time stamp the spreadsheet generates an XY plot (see picture right). The Y-axis shows the measured values, the X-axis represents the comparison values. Ideally all points are loacted on a line y = x (in the diagram shown in red). Small deviations within the measurement accuracy are allowed. If the points are, however, all above or below the ideal line, then probably the height of the station is entered incorrectly in the script. After an appropriate correction of the value of altitude you should repeat the calibration after one week. If everything is correct, you have made this way an exact height determination for your weather station.
Solid construction for continuous operation
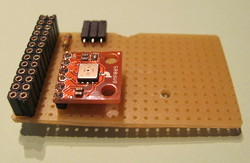
The flying structure with breadboard and Pi Cobbler does not appear particularly well suited for continuous operation. It is better to solder the BMP085 breakout board on a universal solder-able breadboard. This carries also two 13-pin female connectors to connect to the GPIO port of the Raspberry Pi. The breadboard is then piggyback "face-down" plugged directly onto the GPIO port (see pictures on the left and at the beginning of the article).
On the breadboard is still enough space to solder the pull-up resistor and an angled socket connector for a 1-wire temperature sensor DS1820. All this fits into the TEK-BERRY housing of the Raspberry Pi. The USB port is connected with the USB Weather Data Receiver USB WDE1 - and the amateur weather station is finished!
Interesting links
- adafruit learning system: Using the BMP085 with Raspberry Pi
- BMP180 Barometric Pressure Sensor Hookup at Sparkfun
- BMP180 by Bosch Sensortec
- Data sheet BMP085 (PDF)
- Raspberry Pi Wiki at eLinux.org
- Raspberry Pi Foundation
- RRDtool - Open Source data acquisition and visualization tool