Temperature measurement with the Raspberry Pi and the 1-wire temperature sensor DS1820 (USB-serial)

The Raspberry Pi is a fully functional, small and power efficient computer. It is ideal for the realization of measurement and control tasks in the home. The article describes the construction of a temperature measuring station based on the Raspberry Pi and the 1-wire temperature sensor DS1820. Thanks to the extensive software that is available for the operating system Raspberry Pi OS the graphical presentation of the measured values in the network by a web server is easy to set up.
1-wire temperature sensor DS1820
The temperature is measured with multiple sensors of the type DS18S20, DS18B20 or DS1822. The different types are pin and software compatible, they differ basically in the achievable measurement accuracy and price. It is for single unit at about 3 €. The integrated circuit in a TO-92 case includes the temperature sensor, an analog to digital converter, and a 1-wire interface. It is possible to drive the circuit with a parasitic power supply, which allows the use of the single terminal DQ for both data transmission and power supply. Hence the term "1-wire" comes. In addition to this "one wire" is required a second reference potential (ground, GND). One can therefore connect the DS1820 with a simple two-pole twisted pair cable.
n addition, the DS1820 still have a dedicated terminal VDD for the operating voltage of 3 to 5 volts. But this would require a three-core cable. Such active power is necessary if one wants to measure reliably temperatures above about 70° Celsius. VDD and GND are to be connected when using the parasitic power supply.
Multiple DS1820 may be operated parallel on a single 1-wire bus without additional components. Each sensor has a branded unique code for identification.
Raspberry Pi and 1-wire
The Raspberry Pi is a small and cheap computer devloped by the Raspberry Pi Foundation. It controls the temperature sensors, saves the measured values in a database and displays current and historical data. As the provision of the results should be done later via a web service, it is recommended to purchase Modell B with a built-in network interface.
The Linux distribution Raspberry Pi OS is used as operating system. It allows you to easily install the software needed for the project.
To drive a 1-wire bus from the Raspberry Pi there are several possibilities:
- Direct control of a GPIO pin with the 1-wire protocol. This is the solution with the least amount of external circuitry. However, one should bear in mind that here the sensitive GPIO ports are connected without buffering with the potentially lengthy 1-wire bus.
- Using the I2C interface of the Raspberry Pi and an I2Cto 1 wire adapter, for example DS2483 . At first glance, a very elegant solution. The purchase and processing of the DS2483 can be expensive (soldering SMD components) under certain circumstances. It is also unclear to what extent Raspberry Pi OS supports this configuration at the software side.
- Using the internal serial interface of the Pi and an active Serial to 1-wire adapter, for example DS2480B. Also in this case it is an SMD component, which is also designed for the 5 volt operating voltage, while the Pi operates at 3.3 volts. Therefore, here additional voltage transformers are required.
- Use of a finished USB bus master. A solution that does not require soldering. It may happen, however, that a commercially available 1-wire/USB bus master is more expensive than the complete Raspberry Pi!
- Buying a cheap USB to serial converter and DIY a passive Serial to 1-wire adapter. This variant is considered optimum of cost, time and difficulty and presented further below. In particular, this solution is not limited to the Raspberry Pi, but can be run on any computer with a USB or serial interface!
A USB to serial adapter can be purchased for about 6 €. Buyer should pay attention to the support of Linux. Usually these adapters include the Prolific PL2303 chip. The responsible kernel module pl2303 is already part of Raspberry Pi OS. When connecting the USB to serial adapter to a USB port of the Raspberry Pi the corresponding messages should appear in the system log:
$ dmesg
usbcore: registered new interface driver pl2303
USB Serial support registered for pl2303
pl2303 1-1.3:1.0: pl2303 converter detected
usb 1-1.3: pl2303 converter now attached to ttyUSB0
The last line gives information that the serial port of the adapter is controlled over the device file /dev/ttyUSB0. This path is required later when configuring the software. Now, however, it's time to build the Serial to 1-wire adapter.
Serial to 1-wire adapter
For the building of a passive Serial to 1-wire adapter based on the DS9097 according to [OWFS-DS9097] we need the following components:
- 1 Zener diode 6.2 V
- 1 Zener diode 3.9 V
- 2 Schottky diodes 1N5818
- 1 Resistor 1,5 k
- 1 D-Sub 9 pin jack for connecting to the USB/serial converter
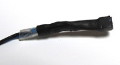
- 1 D-Sub cap with side cable entry
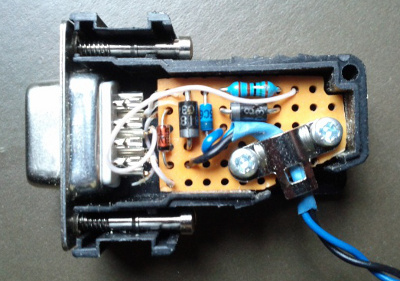
The figure above shows the circuit diagram of the adapter. With a little skill and planning, it is possible to install the adapter on a breadboard inside the D-sub connector housing (pictured right). The diagram shows also the interconnection of two temperature sensors DS1820. These of course are not put into the housing, but are connected via a twisted two-wire cable. The solution omitted here more connectors, sensors are soldered directly to the cable. Several sensors are simply connected in parallel. The construction is carried out as a bus, that is, there is only a single cable, in which the sensors are soldered to the appropriate place. The cable length depends on many factors. In the model a 10 meter long cable with two sensors works reliably.
Temperature measurement with digitemp
After the soldering is completed, you may connect the Serial to 1-wire adapter with the USB/serial adapter. Now a first functional test of the complete electronics can be done. This requires the software DigiTemp. The software package is installed under Raspberry Pi OS with the command:
sudo apt-get install digitemp
The package contains binaries for various 1-wire bus masters. For the DS9097 digitemp_DS9097 is responsible. The command
digitemp_DS9097 -i -s /dev/ttyUSB0
scans the 1-wire bus and lists all found sensors:
DigiTemp v3.5.0 Copyright 1996-2007 by Brian C. Lane
..
Searching the 1-Wire LAN
10XXXXXXXXXXX0AC : DS1820/DS18S20/DS1920 Temperature Sensor
10XXXXXXXXXXX04F : DS1820/DS18S20/DS1920 Temperature Sensor
..
Wrote .digitemprc
The value passed by the -s option is the path to the serial device. Its value can be determined as shown above by analyzing the output of dmesg. But in most cases it should be the same.
DigiTemp creates the file .digitemprc in the current working directory when invoked with the option -i. It contains the IDs of the sensors detected. Thus further program calls need not to rescan the whole bus. This works however only if they take place again in the same directory. Therefore, you should define a working directory now, for example /home/pi/temperature. The output of the temperature readings of all sensors can now be printed with:
digitemp_DS9097 -a
If everything works as intended, you may now cover the sensors and their solder joints with heat shrink tubing to prevent short circuits.
Data Acquisition with RRDtool
With the current state of the project it is possible to log on to the Raspberry Pi and print the current temperature readings on the command line. For a long-term weather data recording the measured values should be written into a database. The blog Weather data acquisition with the USB WDE1 already dealt with the problem of the amount of resulting data and is therefore using the Round Robin Database RRDtool as data storage. This solution applies also here.
RRDtool can also be comfortably installed with the package manager:
sudo apt-get install rrdtool
At the beginning of the work with RRDtool is the definition of the database. Here, we must first think about temporal resolution and extent of data to be stored. One possible definition is:
- Although initially only two sensors are provided, one puts four data sources in the definition of the database. This opens up potential to simply connect additional sensors. A later extension of the database with additional data sources, however, is not straightforward.
- The measurement is based on one value for each quarter hour (900 seconds). This value is kept 10 days which are 4 * 24 * 10 = 960 samples per DataSource.
- After these 10 days, there is an automatic reduction of the data to one average, minimum, and maximum value per day.
- The retention time of the daily values is 10 years, that are 3600 samples per DataSource.
This yields the following call of rrdtool to create the database.
rrdtool create temperature.rrd --step 900 \
DS:temp0:GAUGE:1200:-40:80 \
DS:temp1:GAUGE:1200:-40:80 \
DS:temp2:GAUGE:1200:-40:80 \
DS:temp3:GAUGE:1200:-40:80 \
RRA:AVERAGE:0.5:1:960 \
RRA:MIN:0.5:96:3600 \
RRA:MAX:0.5:96:3600 \
RRA:AVERAGE:0.5:96:3600
The parameter --step 900 defines the basic data collection interval to 900 seconds (15 minutes).
Then follows the definition of data sources (DS) - one for each sensor. The names of the DataSources are following the scheme tempn for the temperature sensor n. The temperature range is limited to -40..80 °C.
At the end there is the declaration of the Round Robin Archives (RRA), which are responsible for the actual data storage. The first definition specifies that the database stores 960 samples undiluted, that is, with a step size of 1. The following three RRAs cause the storage of 3600 minimum, maximum and average values. The calculation of these three variables is carried out for each of 96 samples, which is exactly one day (96 * 900 seconds).
Running the command creeates the nearly 400-kilobyte file temperature.rrd in the current working directory. The file size does not change, no matter how many records are inserted - after all it is a round-robin database!
Recording is in progress...
The data gets inserted into the database with the command rrdtool update. A transformation of the output provided by digitemp is required into an accepted form of rrdtool. The necessary operations are put into the shell script gettemp.s:
#!/bin/bash
# Get temperature readings from the sensors and save them to RR database
#
# Path to digitemp
DIGITEMP=/usr/bin/digitemp_DS9097
# DS names of the existing sensors
SENSORS=temp0:temp1
# Change to the directory with the database and .digitemprc
cd /home/pi/temperature

data=`$DIGITEMP -a -q -o 2 | awk 'NF>1 {OFS=":"; $1="N"; print}'`
if [ -n "$data" ] ; then
        rrdtool update temperature.rrd -t $SENSORS $data
fi
The successful execution of the script (don't forget to set the execute permissions with chmod + x gettemp.s) causes an update of the modification date of the round-robin database file. You can also test the success with rrdtool last update temperature.rrd that prints the last written record.
For continuous use the script is run on a regular basis all five minutes through the cron scheduling service. Because the database is configured with a measurement interval of 15 minutes, an averaging over three readings happens. To create a crontab entry you may edit the crontab interactively with crontab -e or use the command:
echo '*/5 * * * * $HOME/temperature/gettemp.s >> $HOME/temperature/gettemp.log 2>&1' | crontab -
The output redirection causes any error messages get into the file gettemp.log whose contents you should therefore check regularly.
Graphic
An outstanding feature of rrdtool is the built-in graphics engine that can create appealing graphics. To plot a graph of the temperature history of the last 24 hours, one may use:
rrdtool graph tempday.png \
  -s 'now - 1 day' -e 'now' \
  DEF:temp0=temperature.rrd:temp0:AVERAGE \
  LINE2:temp0#00FF00:Inside \
  VDEF:temp0last=temp0,LAST \
  "GPRINT:temp0last:%.1lf °C" \
  DEF:temp1=temperature.rrd:temp1:AVERAGE \
  LINE2:temp1#0000FF:Outside \
  VDEF:temp1last=temp1,LAST \
  "GPRINT:temp1last:%.1lf °C"

For more examples with graphics, see Weather data acquisition with the USB WDE1 and rrdgraph_examples.
For the Web!
Now maybe you want to provide the weather data to a wider range of users. This requires the installation of a web server on the Raspberry Pi. A relatively lightweight variant is lighttpd. The installation is done by:
sudo apt-get install librrds-perl lighttpd
The second package installed librrds-perl is a Perl module to control rrdtool. You will need it later in a CGI script programmed with Perl. The script is used to dynamically generate the temperature history graph. They change every quarter hour, so static HTML pagea and graphics alone are not sufficient.
However, one must lighttpd once allow to execute Perl CGI scripts. For this root privileges are required which must be acquired through sudo -s. Then enable the modules cgi and userdir (more on that later):
sudo -s
lighty-enable-mod cgi
lighty-enable-mod userdir
Now edit the file /etc/lighttpd/conf-enabled/10-cgi.conf to tell lighttpd to execute Perl scripts with the extension .pl. You have to uncomment the appropriate line inside the block cgi.assign:
cgi.assign      = (
        ".pl"  => "/usr/bin/perl"
)
Then you restart the server and leave the superuser mode:
/etc/init.d/lighttpd restart
exit
The enabling of the module userdir causes lighttpd to serve HTML files and CGI scripts that are located in the home directories of the users below the sub directory public_html. Thus, normal users as pi can create and edit web pages, root privileges shall not be required. You should now try once by creating the HTML file index.html in the directory /home/pi/public_html. A minimum index.html would look like this:
<html>
<body>
<h1>Temperature</h1>
</body>
</html>
Entering the address http://localhost/~ pi/ into a web browser should now display the HTML page - if you read this article on the Raspberry Pi! Otherwise, of course, you should replace localhost by its host name or IP address.
If this doesn't work as expected, the first step is to check the access rights for the involved directories and files. Since lighttpd runs under the user www-data, but the files belong to the user pi, the permissions for "others" are crucial here. In particular, current Linux distributions, by default, prohibit read (r) and execute (x) permissions for "others" on users' home directories. This means that lighttpd can no longer access public_html, as a user needs execute permissions for every single folder in the path to reach the target directory. One possible solution is to grant execute permissions for the home directory and all its subdirectories:
sudo chmod -R o+X /home/pi
Next, it goes to the creation of the Perl CGI script which generates the graph. The following script code should be stored into the file graph.pl in the same directory as index.html.
#!/usr/bin/perl
#
# CGI script to create image using RRD graph
use CGI qw(:all);
use RRDs;
use strict;

# path to database
my $rrd='/home/pi/temperature/temperature.rrd';

# size
my $width=400;
my $height=100;

# read and check query params
my $query=new CGI;
my $type=$query->param('type');
$type='day' unless $type =~ /day|week|month|year/;

# write image into temp file
my $tmpfile="/tmp/graphx_$$.png";
my @opts=("-v", "°C",
"-w", $width,
"-h", $height,
"-s", "now - 1 $type",
"-e", "now",
"-D");
RRDs::graph($tmpfile,
  @opts,
  "DEF:temp0=$rrd:temp0:AVERAGE",
  "LINE2:temp0#00FF00:Inside",
  "DEF:temp1=$rrd:temp1:AVERAGE",
  "LINE2:temp1#0000FF:Outside"
);
# check error
my $err=RRDs::error;
die "$err\n" if $err;

# feed tmpfile to stdout
open(IMG, $tmpfile) or die "can't open $tmpfile\n";
print header(-type=>'image/png', -expires=>'+1m');
print <IMG>;
close IMG;
unlink $tmpfile;
Core of the script is to call RRDs::graph to generate the graph using rrdtool. In this case, some parameters are passed as a variable, for example, the path to the database or the size of the graph. RRDs::graph writes the image into a temporary file, then the script copies it to its standard output. This in turn delivers the web server to the browser. First, however, the content-type image/png will be issued so that the browser knows that now arrive image data.
A special feature is the ability to pass the time by means of the query parameter type as part of the URL when calling the script. The URL http://localhost/~pi/graph.pl?type=week, for example, generates the temperature history over the last week. Other possible values for type should be able to easily read from the above script code. The graphics can be integrated using the img tag in the HTML page, for example:
<img src="graph.pl?type=month">
You can of course do this several times so that the pages then contains four graphics for daily, weekly, monthly and annual temperature curves, like at weather recording - Fixed periods.
Or there is only one graph and the user may select the time period. The key to this is an HTML form that defines the possible periods and corresponding query parameters in the form of radio buttons. An iframe and specifying the target attribute with the name of the iframe ensure that the browser is rendering the graph on the same page. The following code snippet shows this examplary:
<iframe marginwidth="0" marginheight="0" frameborder="0" width="400" height="100" name="graph">
</iframe>
<form action="graph.pl" method="get" target="graph">
  <fieldset>
  <legend>Time</legend>
  <input type="radio" name="type" value="day" checked="checked"/>Day
  <input type="radio" name="type" value="week"/>Week
  <input type="radio" name="type" value="month"/>Month
  <input type="radio" name="type" value="year"/>Year
  </fieldset>
  <input type="submit" value="Show" />
</form>

The result can be seen in the picture at the right, a more extensive example is Weather recording - Any period.
The web server running on the Raspberry Pi is limited in its performance due to the hardware. One should not expect, therefore, that it is able to handle a guge amount of page requests. Particular caution should be exercised if the web server is publically exposed to the Internet. Faulty or negligent programmed CGI scripts are very often the source of seriuos security risks. If in doubt you should consult an experienced programmer or security expert. In general, without further examination the techniques described here are only suitable for the hobby and private use!
Conclusion
The article is not a complete "step-by-step" assembly instruction, but it should stimulate you to develop your own, creative DIY solutions. At the end of a successful project we have learned a lot about electronics, programming, Linux, and weather stations. Two prototypes built according to the described pattern operate reliably for several years.
Published at Feb 17, 2015, last update Mar 28, 2026.
Interesting links
- Weather data acquisition with the USB WDE1 - A similar project with wireless sensors
- 1-wire temperature sensor DS1820 on Raspberry Pi - Minimal variant for a 1-wire bus on Raspberry Pi
- Raspberry Pi
- Raspberry Pi Foundation
- OWFS 1-Wire File System - Comprehensive reference to 1-wire hardware and software
- DigiTemp Software for 1-wire temperature measurement
- RRDtool - Open Source data acquisition and visualisization tool